
DESI
has made the largest 3D map of our universe to date. Earth is at the center of
this thin slice of the full map. In the magnified section, it is easy to see
the underlying structure of matter in our universe. Credit: Claire Lamman/DESI
collaboration; custom colormap package by cmastro
With
5,000 tiny robots in a mountaintop telescope, researchers can look 11 billion
years into the past. The light from far-flung objects in space is just now
reaching the Dark Energy Spectroscopic Instrument (DESI), enabling us to map
our cosmos as it was in its youth and trace its growth to what we see today.
Understanding how our universe has
evolved is tied to how it ends, and to one of the biggest mysteries in physics: dark energy, the unknown ingredient causing our universe to
expand faster and faster.
To study dark energy's effects over the
past 11 billion years, DESI has created the largest 3D map of our cosmos ever
constructed, with the most precise measurements to date. This is the first time
scientists have measured the expansion history of the young universe with a
precision better than 1%, giving us our best view yet of how the universe
evolved.
Researchers shared the analysis of their
first year of collected data in multiple papers that will be posted today on the arXiv pre-print server and in talks at
the American
Physical Society meeting in
the United States and the Rencontres de Moriond in Italy.
"We're incredibly proud of the
data, which have produced world-leading cosmology results and are the first to
come out of the new generation of dark energy experiments," said Michael
Levi, DESI director and a scientist at the Department of Energy's Lawrence
Berkeley National Laboratory (Berkeley Lab), which manages the project.
"So far, we're seeing basic agreement with our best model of the universe, but we're also seeing some potentially interesting differences that could indicate that dark energy is evolving with time. Those may or may not go away with more data, so we're excited to start analyzing our three-year dataset soon."
This animation shows how baryon acoustic
oscillations act as a cosmic ruler for measuring the expansion of the universe.
Credit: Claire Lamman/DESI collaboration and Jenny Nuss/Berkeley Lab
Our leading model of the universe
is known as Lambda CDM. It includes both a weakly interacting type of matter
(cold dark matter, or CDM) and dark energy (Lambda). Both matter and dark
energy shape how the universe expands—but in opposing ways. Matter and dark
matter slow the expansion down, while dark energy speeds it up. The amount of
each influences how our universe evolves. This model does a good job of
describing results from previous experiments and how the universe looks
throughout time.
However, when DESI's first-year
results are combined with data from other studies, there are some subtle
differences with what Lambda CDM would predict. As DESI gathers more
information during its five-year survey, these early results will become more
precise, shedding light on whether the data are pointing to different
explanations for the results we observe or the need to update our model.
More data will also improve DESI's
other early results, which weigh in on the Hubble constant (a measure of how
fast the universe is expanding today) and the mass of particles called
neutrinos.
"No spectroscopic experiment
has had this much data before, and we're continuing to gather data from more
than a million galaxies every month," said Nathalie Palanque-Delabrouille,
a Berkeley Lab scientist and co-spokesperson for the experiment.
"It's astonishing that with only our first year of data, we can already measure the expansion history of our universe at seven different slices of cosmic time, each with a precision of 1 to 3%. The team put in a tremendous amount of work to account for instrumental and theoretical modeling intricacies, which gives us confidence in the robustness of our first results."

This
artist's rendering shows light from quasars passing through intergalactic
clouds of hydrogen gas. Researchers can analyze the light to learn about
distant cosmic structure. Credit: NOIRLab/NSF/AURA/P. Marenfeld and DESI
collaboration
DESI's overall precision on the
expansion history across all 11 billion years is 0.5%, and the most distant
epoch, covering 8–11 billion years in the past, has a record-setting precision
of 0.82%. That measurement of our young universe is incredibly difficult to
make.
Yet within one year, DESI has
become twice as powerful at measuring the expansion history at these early
times as its predecessor (the Sloan Digital Sky Survey's BOSS/eBOSS), which
took more than a decade.
"We are delighted to see
cosmology results from DESI's first year of operations," said Gina
Rameika, associate director for High Energy Physics at DOE. "DESI
continues to amaze us with its stellar performance and is already shaping our
understanding of the universe."
Traveling back in time
DESI is an international collaboration of more than 900 researchers from over 70 institutions around the world. The instrument sits atop the U.S. National Science Foundation's Nicholas U. Mayall 4-meter Telescope at Kitt Peak National Observatory, a program of NSF's NOIRLab.
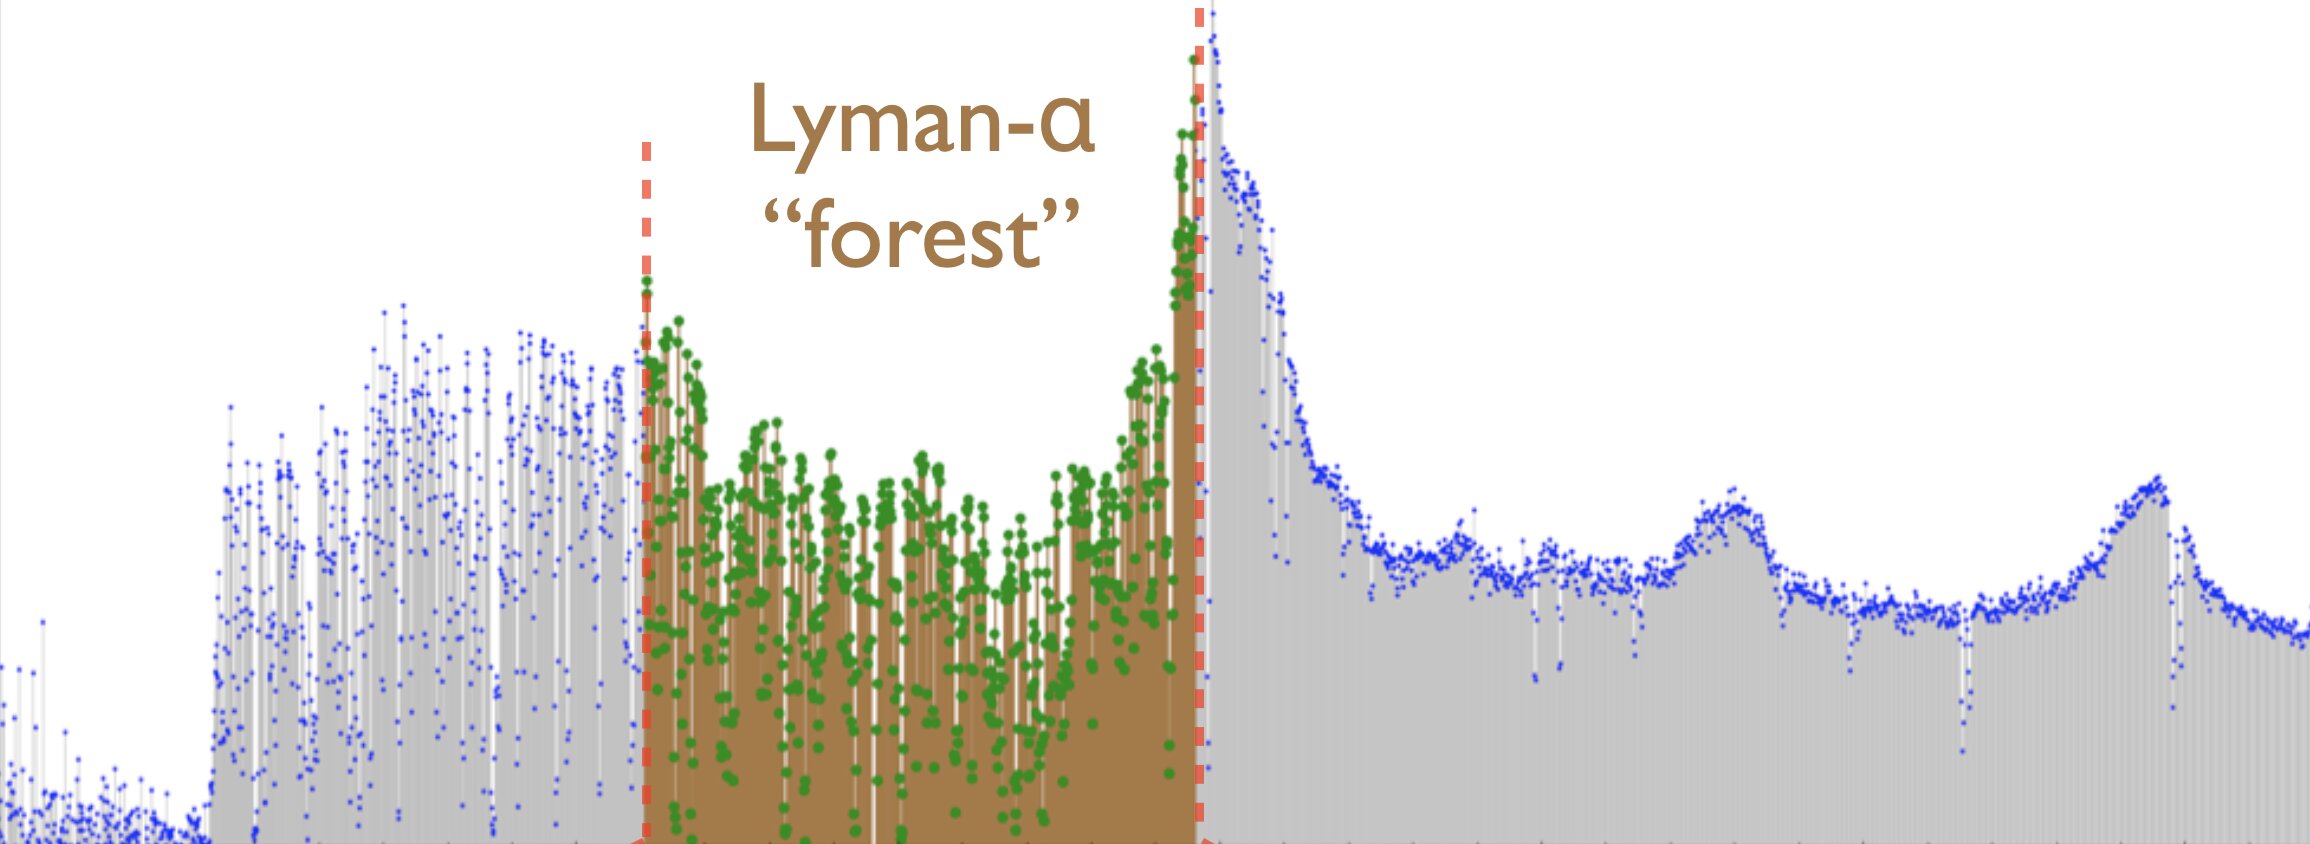
As
light from a distant quasar passes through gas in space, certain wavelengths of
light are absorbed. Plotting the absorption lines reveals the "Lyman-alpha
forest" (emphasized here in brown and green) and provides information
about the distant clouds of gas between us and the quasar. Credit: David
Kirkby/DESI collaboration
Looking
at DESI's map, it's easy to see the underlying structure of the universe:
strands of galaxies clustered together, separated by voids with fewer objects.
Our very early universe, well beyond DESI's view, was quite different: a hot,
dense soup of subatomic particles moving too fast to form stable matter like
the atoms we know today. Among those particles were hydrogen and helium nuclei,
collectively called baryons.
Tiny fluctuations in this early ionized
plasma caused pressure waves, moving the baryons into a pattern of ripples that
is similar to what you'd see if you tossed a handful of gravel into a pond. As
the universe expanded and cooled, neutral atoms formed and the pressure waves
stopped, freezing the ripples in three dimensions and increasing clustering of
future galaxies in the dense areas.
Billions of years later, we can still
see this faint pattern of 3D ripples, or bubbles, in the characteristic
separation of galaxies—a feature called Baryon Acoustic Oscillations (BAOs).
Researchers use the BAO measurements as a cosmic ruler. By measuring the apparent size of these bubbles, they can determine distances to the matter responsible for this extremely faint pattern on the sky. Mapping the BAO bubbles both near and far lets researchers slice the data into chunks, measuring how fast the universe was expanding at each time in its past and modeling how dark energy affects that expansion.

DESI's
Hubble diagram plots a characteristic pattern – baryon acoustic oscillations,
or BAO "bubbles" – at different ages of the universe. The amount of
dark energy determines how fast the universe grows, and therefore the size of
the bubbles. The solid line is how big Lambda CDM predicts the bubbles will be,
while the dashed line shows the prediction from a different model where dark
energy evolves with time. DESI will gather more data to determine which model
is a better description of the universe. Credit: Arnaud de Mattia/DESI
collaboration
"We've
measured the expansion history over this huge range of cosmic time with a
precision that surpasses all of the previous BAO surveys combined," said
Hee-Jong Seo, a professor at Ohio University and the co-leader of DESI's BAO
analysis. "We're very excited to learn how these new measurements will
improve and alter our understanding of the cosmos. Humans have a timeless
fascination with our universe, wanting to know both what it is made of and what
will happen to it."
Using galaxies to measure the expansion
history and better understand dark energy is one technique, but it can only
reach so far. At a certain point, light from typical galaxies is too faint, so
researchers turn to quasars, extremely distant, bright galactic cores with
black holes at their centers. Light from quasars is absorbed as it passes
through intergalactic clouds of gas, enabling researchers to map the pockets of
dense matter and use them the same way they use galaxies—a technique known as
using the "Lyman-alpha forest."
"We use quasars as a backlight to
basically see the shadow of the intervening gas between the quasars and
us," said Andreu Font-Ribera, a scientist at the Institute for High Energy
Physics (IFAE) in Spain who co-leads DESI's Lyman-alpha forest analysis.
"It lets us look out further to when the universe was very young. It's a
really hard measurement to do, and very cool to see it succeed."
Researchers used 450,000 quasars, the largest set ever collected for these Lyman-alpha forest measurements, to extend their BAO measurements all the way out to 11 billion years in the past. By the end of the survey, DESI plans to map 3 million quasars and 37 million galaxies.

A
simplified explanation of the different parts of DESI's Hubble diagram. Credit:
Claire Lamman/DESI collaboration
State-of-the-art science
DESI is the first spectroscopic
experiment to perform a fully "blinded analysis," which conceals the
true result from the scientists to avoid any subconscious confirmation bias.
Researchers work in the dark with modified data, writing the code to analyze
their findings. Once everything is finalized, they apply their analysis to the
original data to reveal the actual answer.
"The way we did the analysis gives
us confidence in our results, and particularly in showing that the Lyman-alpha
forest is a powerful tool for measuring the universe's expansion," said
Julien Guy, a scientist at Berkeley Lab and the co-lead for processing
information from DESI's spectrographs.
"The dataset we are collecting is exceptional, as is the rate at which we are gathering it. This is the most precise measurement I have ever done in my life."
In this 360-degree video, take an interactive
flight through millions of galaxies mapped using coordinate data from DESI.
Credit: Fiske Planetarium, CU Boulder and DESI collaboration
DESI's data will be used to
complement future sky surveys such as the Vera C. Rubin Observatory and Nancy
Grace Roman Space Telescope, and to prepare for a potential upgrade to DESI
(DESI-II) that was recommended in a recent report by the U.S. Particle Physics Project
Prioritization Panel.
"We are in the golden era of
cosmology, with large-scale surveys ongoing and about to be started, and new
techniques being developed to make the best use of these datasets," said
Arnaud de Mattia, a researcher with the French Alternative Energies and Atomic
Energy Commission (CEA) and co-leader of DESI's group interpreting the
cosmological data.
"We're all really motivated to see whether new data will confirm the features we saw in our first-year sample and build a better understanding of the dynamics of our universe."
No comments:
Post a Comment