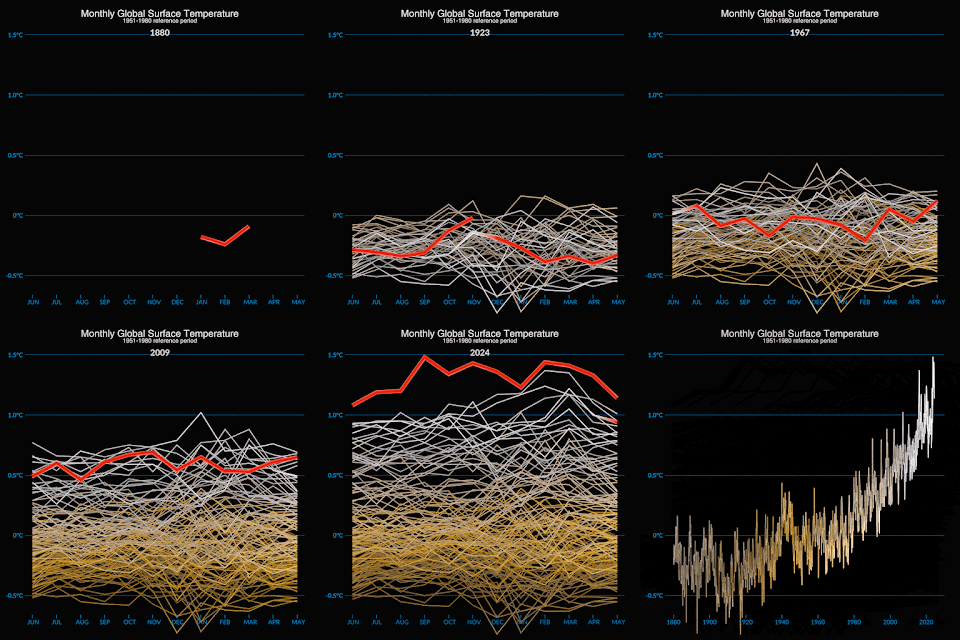
This visualization shows monthly global surface temperatures from 1880 to May 2024. The last 12 months (June 2023 through May 2024) hit record highs for each respective month. Download this visualization from NASA Goddard’s Scientific Visualization Studio: https://svs.gsfc.nasa.gov/5311 NASA’s Scientific Visualization Studio
May 2024 was the warmest May on the books, marking a full year of
record-high monthly temperatures, NASA scientists found. Average global
temperatures for the past 12 months hit record highs for each respective month
– an unprecedented streak – according to scientists from NASA’s Goddard
Institute for Space Studies (GISS) in New York.
“It’s clear we are facing a climate
crisis,” said NASA Administrator Bill Nelson. “Communities across America—like
Arizona, California, Nevada—and communities across the globe are feeling
first-hand extreme heat in unprecedented numbers. NASA and the Biden-Harris
Administration recognize the urgency of protecting our home planet. We are
providing critical climate data to better lives and livelihoods, and benefit
all humanity.”
The run of record temperatures fits
within a long-term warming trend driven by human activity — primarily
greenhouse gas emissions. The trend has become evident over the past four
decades, with the last 10 consecutive years being the warmest 10 since record-keeping began in the late 19th century. Before this
streak of 12 straight months of record temperatures, the second longest streak
lasted for seven months between 2015 and 2016.
“It’s clear we are facing a climate crisis.
Communities across America—like Arizona, California, Nevada—and communities
across the globe are feeling first-hand extreme heat in unprecedented numbers.
BILL NELSON
NASA Administrator Bill Nelson
“We’re experiencing more hot days, more hot months, more hot years,” said
Kate Calvin, NASA’s chief scientist and senior climate advisor. “We know that
these increases in temperature are driven by our greenhouse gas emissions and
are impacting people and ecosystems around the world.”
In NASA’s analysis, a temperature baseline is defined by several decades
or more – typically 30 years. The average global temperature over the past 12
months was 2.34 degrees Fahrenheit (1.30 degrees Celsius) above the 20th
century baseline (1951 to 1980). This is slightly over the 2.69 degree
Fahrenheit (1.5 degree Celsius) level with respect to the late 19th century
average.
To calculate Earth’s global
temperature, NASA scientists gather data from tens of thousands of
meteorological stations on land, plus thousands of instruments on ships and
buoys on the ocean surface. This raw data is analyzed using methods that
account for the varied spacing of temperature stations around the globe and for
urban heating effects that could skew the calculations.
El Niño Subsiding, La Niña Arriving?
Phenomena such as El Niño and La
Niña, which alternately warm and cool the tropical Pacific Ocean, can
contribute a small amount of variability in global temperatures from year to
year. The strong El Niño that began in spring 2023 helped stoke last year’s extreme summer and fall heat.
As of May 2024, scientists at the NOAA (National Oceanic and Atmospheric Administration) Climate Prediction Center projected a 49% chance of La Niña developing between June and August, and a 69% chance of it developing between July and September. By cooling a large swath of the tropical Pacific, a La Niña event could partially suppress average global temperatures this year.
Dr. Kate Calvin, NASA’s Chief Scientist and
Senior Climate Advisor, answers some of the top questions pertaining to these
temperature records and our changing climate. NASA’s Goddard Space Flight
Center/ Katie Jepson
It’s hard to know whether 2024 will
set another global heat record. Factors like volcanic eruptions and
sun-blocking aerosol emissions can affect our climate in any given year. NASA missions are actively
studying these influences, said Gavin Schmidt, director of GISS.
“There are open questions that can
impact our predictions over the next few years and decades, and we’re in
evidence-gathering mode,” Schmidt said. “This year may well end up setting
another global temperature record. Right now, it’s in line to be close to
2023.”
Ocean Temperatures and Hurricanes
Scientists are watching to see how
ocean temperatures may influence this year’s hurricane season. Temperatures
remained high as the 2024 hurricane and typhoon seasons got underway. Across
the Northern Hemisphere, ocean temperatures for the January-April period were
2.12 degrees Fahrenheit (1.18 degrees Celsius) above average, according to NOAA. Despite the waning El Niño, temperatures at the sea surface and at deeper
depths are still above average in many places, said Josh Willis, an
oceanographer at NASA’s Jet Propulsion Laboratory in Southern California.
Willis cited rising carbon dioxide
emissions as the main driver of ocean warming. As much as 90% of the excess atmospheric heat in recent decades has
been absorbed by the ocean, with much of that heat stored near the water
surface.
“The ocean is the flywheel of our
climate,” Willis said. “Since the ocean covers more than two-thirds of Earth,
whatever sea surface temperatures are, the rest of the planet
follows.”
La Niña years also can contribute
to more active Atlantic hurricane seasons. That’s because La Niña conditions
weaken westerly winds high in the atmosphere near the Americas, over the
Caribbean Sea and tropical Atlantic Ocean. Wind shear – abrupt changes in wind
speed and direction – can cut hurricanes down before they grow. La Niña
effectively lifts this brake, allowing tropical storms to form and intensify
unimpeded.
NASA’s full dataset of global
surface temperatures, as well as details of how NASA scientists conducted the analysis, are
publicly available from GISS, a NASA laboratory managed by the agency’s Goddard
Space Flight Center in Greenbelt, Maryland.
Sally Younger
Senior Science Writer
Source: NASA Analysis Confirms a Year of Monthly Temperature Records - NASA

No comments:
Post a Comment